Elastic SIEM
Elastic is a solution that can provide search and observability options for monitoring your Bitwarden organization. Elastic Agent provides the capability to monitor collection, event, group, and policy information with the Elastic Bitwarden integration.
To begin, start by creating an Elastic account. This step is required in order to set up a dashboard to monitor data with Elastic's cloud hosted service (recommended), or on-premise service.
Monitoring data will require the use of Elastic Search as well as Kibana to visualize data.
On the Elastic home screen, scroll down and locate Add Integrations.

Add Elastic Integration Once you are on the integrations catalogue, enter Bitwarden into the search field and select Bitwarden.

Bitwarden Elastic Integration Select the Add Bitwarden button to install the integration.
If this is your first Elastic integration, you will be required to install Elastic Agent. On the following screen, select Install Elastic Agent and follow the installation instructions.

Install Elastic Agent In order to run the Bitwarden integration, Elastic Agent is required to maintain the integration data. Once the installation is complete, Elastic will detect the successful installation. After the agent has been successfully setup, select Add the integration.

Elastic setup
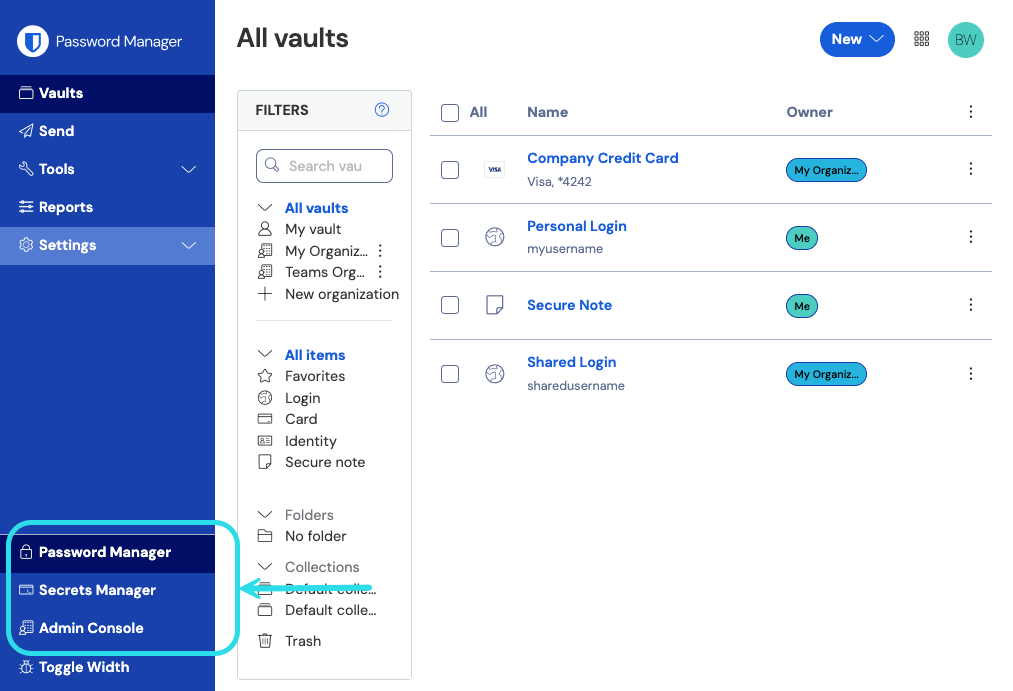
Once you have added the Bitwarden integration, you will be brought to the setup screen to configure the integration. Keep this screen open, on another tab, log in to the Bitwarden web app and open the Admin Console using the product switcher:

Navigate to your organization's Settings → Organization info screen and select the View API key button. You will be asked to re-enter your master password in order to access your API key information.

Input the following information into the corresponding fields:
Elastic Field | Value |
|---|---|
URL | For Bitwarden cloud users, the default url will be For self-hosted Bitwarden users, input your self-hosted URL. Be sure that the URL does not include any trailing forward slashes at the end of the URL " |
Client ID | Input the value for |
Client Secret | Input the value for |
note
Your organization API key information is sensitive data. Do not share these values in nonsecure locations.
Once you have completed the required fields, continue scrolling down the page to apply desired data collection settings. Select Confirm incoming data once you are finished.
note
Additional Advanced options are available for configuration at this point. The minimum required fields are highlighted above to add the Bitwarden integration. To access the integration at a later point to edit the setup, go to the menu and select Integrations → Installed integrations → Bitwarden → Integration policies.
If all the data was entered correctly, Elastic will confirm incoming data and provide a preview of incoming data. Select View assets to monitor your data.
Once setup is completed you can begin reviewing your Bitwarden Organization data. Select any of the Bitwarden Dashboards to monitor data relative to the dashboard. Here is a brief overview of each dashboard's monitored data:
Log | Description |
|---|---|
[Logs Bitwarden] Policy | Review policy changes for an organization such as enabling, disabling, or updating organizational policies. |
[Logs Bitwarden] Group and Collection | Monitor recorded event for groups and collections related to the organization. |
[Logs Bitwarden] Event | Monitor organizational event logs. Learn more about event logs here. |
Queries
Elastic data monitoring utilized the Kibana Query Language (KQL) for filtering data. To learn more about queries and searches, see the Elastic query documentation.
Suggest changes to this page
How can we improve this page for you?
For technical, billing, and product questions, please contact support